What Is Residual Risk (and How Do You Calculate It)?

Do you really want to know if the business recovery plans you’ve put into place will work or not? If the answer is yes, you should use residual risk as part of your business continuity management strategy.
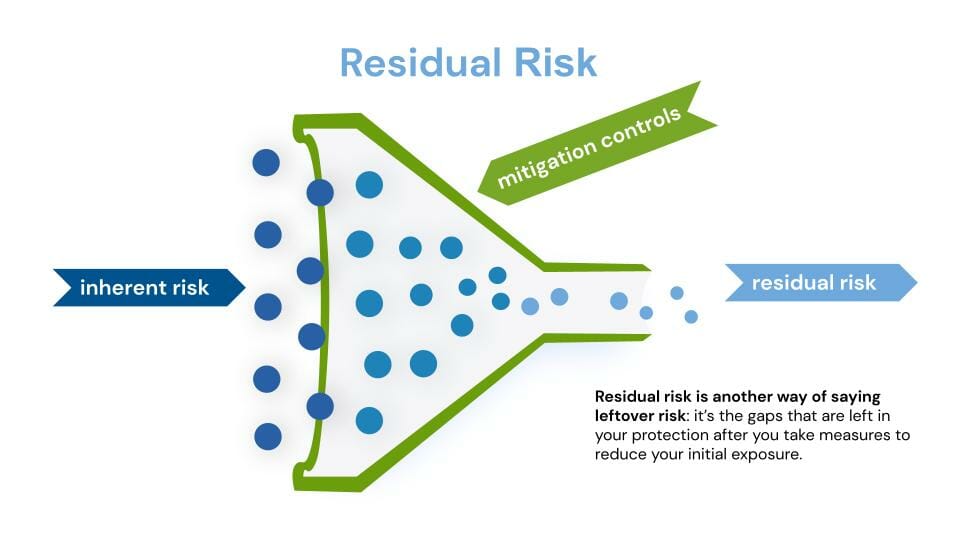
Closely interwoven with inherent risk, residual risk can serve as justification for the time and resources required to support your recovery needs. By definition, it is the risk that remains after all efforts have been made to identify and eliminate risk.
In other words: Are you doing enough to support your business recovery plan? A residual risk calculation will tell you definitively.
Despite the fact that many businesses are devoting time and resources to creating business recovery strategies, few are concerned with measuring the effectiveness of their efforts—only three people in my most recent seminar of 50 were measuring risk at all. In fact, no recovery strategy is complete until you’ve taken this important step. Wondering how to calculate residual risk? Take a look below to see how we do it.
How To Calculate Residual Risk
Step 1: Identify the inherent risk factor.
A. First, determine the recovery time objective (RTO) for the business unit. Though there may be two, three, four, or more processes associated with a particular unit, the residual risk formula considers only the RTO of the most critical process. So if Process A needs to be recovered in 24 hours and Process B is 48 hours, evaluate the business recovery plan for the unit using only the RTO for Process A.
The RTOs of each business unit and their business processes should have been uncovered as part of the BIA process.
B. Next, determine the business impact score. Each RTO category has a level of potential business impact associated with it. A critical business unit with a very short recovery timeframe indicates a high level of criticality and would therefore have a significant impact on the business should a disruption occur versus a business unit with a much longer recovery timeframe. Each RTO would have a corresponding impact score associated with it, such as:
- 1 = Insignificant Impact
- 2 = Minimal Impact
- 3 = Moderate Impact
- 4 = Critical Impact
- 5 = Catastrophic Impact
Putting It Into Practice
If, for example, the RTO of a call center is identified as 12 hours or less, this typically indicates a highly critical process. Based on the criticality assessment, the call center plan would get a business impact score of 4 or 5.
C. Identify the threat landscape and assign a threat probability level. Evaluate the natural, human-made, and technological threats facing the business unit. Is it in a high-risk area geographically (for any reason)? Are its processes especially vulnerable to attack? Assign a threat-level score to the unit, with 5 being high, 3 being moderate, and 1 being low.
D. Calculate the inherent risk factor. Multiply the business impact score and the threat landscape score; then divide by 5. The resulting number is the plan’s inherent risk level.
What Does The Score Mean?
Scores will range anywhere from 2.0 to 5.0. A score between 4 and 5 means that the plan has high inherent risk. A score between 3 and 3.9 has moderate inherent risk. Anything lower than that has low inherent risk.
Step 2: Identify management’s level of risk tolerance.
A. First, educate management. Management will be unfamiliar with the concept of residual risk calculation and its significance. It’s up to you to explain to the management team how it works and why it’s important.
B. Next, advise management on an acceptable level of risk tolerance. Based on the level of inherent risk, assign a percentage to indicate how much risk your management team should be willing to accept, for example:
- If the inherent risk factor is between 4 and 5—10% (low risk tolerance).
- If the inherent risk factor range is between 3 and 3.9—15% (moderate risk tolerance).
- If the inherent risk factor is less than 3—20% (high risk tolerance).
The lower the percentage, the tighter your controls should be. The more effort you put into it, the better your chance of recovery will be.
C. Finally, calculate management’s level of risk tolerance. Multiply the percentage of risk tolerance times the inherent risk factor. The resulting score is your risk tolerance.
Putting It Into Practice
Based on an inherent risk factor (business impact score) of 5, we identified our level of risk tolerance as low (10%). Multiply the risk factor by the risk tolerance (10% x 5); that’s 0.5. So, your maximum risk tolerance is 0.5. To get your risk factor-tolerance score, subtract 0.5 from 5; that’s 4.5. This means our mitigating controls must be in a state that their level of capability adds up to 4.5 or better to be within tolerance.
Step 3: Assess and score your mitigating controls.
A. First, assign weights to your mitigating controls based on their importance. The controls that we think protect a recovery plan are:
- Business Impact Analysis
- Recovery Strategy
- Recovery Exercises
- Recovery Plan
- Recovery Team
- Third Party Supplier Risk
- Training & Awareness
Want more information about how to weigh and evaluate your mitigating controls? The Residual Risk (R2) online tool can help.
Controls should be weighted based on how important each one is to the success of the plan. In our view, the two most important controls (and the ones that should be most heavily weighted) are the recovery strategy (the plan you actually have in place to recover a particular business unit) and recovery exercises (the practice you’ve had testing the plan and its ability to help you recover).
B. Next, evaluate each of your mitigating controls against the standards. Is your recovery plan in line with the recommendations outlined in the standards? Depending on how well each control stands up to the recommended qualifications, give it either a 1 (poor), 3 (average), or 5 (best practice).
C. Finally, determine the weighted score of your mitigating controls. For each control, multiply the score times the weight. Then, add up those results to come up with one overall score for your mitigating controls (your mitigating control state).
Putting It Into Practice
If the BIA is scored a 5 (best practice) and is weighted 10%, multiply 10% by 5; that’s a weighted score of 0.5 for this mitigating control. Do same for each of the controls. Add the scores for each to determine your overall mitigating control state.
Step 4: Calculate your residual risk.
To complete the residual risk formula, compare the mitigating control state to the risk factor-tolerance number. Look at the resulting number. How close is it to the risk factor-tolerance number? If it’s equal to or higher than the risk factor-tolerance number, you are well within tolerance range. The business recovery plan you’ve created is right on the mark.
If the number is lower than your risk tolerance, the plan is insufficient. Depending on how far off the mark you are, you’ll have to take further action to improve the strength of your business recovery plan.
Need help calculating residual risk?
For further guidance on how to calculate residual risk, take a look at our Residual Risk (R2) application. Part of the BCMMetrics™ suite of business continuity software, it is designed to provide BCM practitioners and risk managers with a simple, quantitative method to evaluate risk. You can easily assess the risk factor of each business unit or system/application recovery plan, weight the importance of mitigating controls and evaluate them, establish risk tolerance levels, and perform a residual risk calculation for each plan. BCMMetrics also comes with the Compliance Confidence (C2) tool, which gives you a “FICO-like” score for your business continuity planning.
With the BCMMetrics suite of self-assessment applications, you’ll have everything you need to ensure that your business continuity program complies with current standards and minimizes residual risk. Want to see the tool in action? Schedule a demo.

Michael Herrera
Michael Herrera is the Chief Executive Officer (CEO) of MHA. In his role, Michael provides global leadership to the entire set of industry practices and horizontal capabilities within MHA. Under his leadership, MHA has become a leading provider of Business Continuity and Disaster Recovery services to organizations on a global level. He is also the founder of BCMMETRICS, a leading cloud based tool designed to assess business continuity compliance and residual risk. Michael is a well-known and sought after speaker on Business Continuity issues at local and national contingency planner chapter meetings and conferences. Prior to founding MHA, he was a Regional VP for Bank of America, where he was responsible for Business Continuity across the southwest region.


One thought on “What Is Residual Risk (and How Do You Calculate It)?”
Comments are closed.