Residual Risk
Quantify Your Risk Exposure

A Quantitative Method to Evaluate Risk
Residual Risk can be used to quantitatively identify where pockets of residual risk exist, determine the magnitude of the remaining residual risk and evaluate if the residual risk needs to be mitigated, transferred, or accepted.
The Residual Risk tool assesses the risk that remains after an organization has implemented appropriate controls.
The Residual Risk assessment tool will provide you with a Residual Risk score for each of your plans and help you determine whether it is within or outside the Risk Appetite set by management.
ASSIGN IMPACT FACTORS
RISK-BASED AUDITING
DETERMINE RESIDUAL RISK
EVALUATE FOR IMPROVEMENT
See Residual Risk in Action
Key Functionalities
- Cloud-based, secure tool to measure enterprise BCM program residual risk.
- Easy to use tool provides the opportunity to perform unlimited self-assessments of your enterprise BCM program based on your needs.
- Scoring provides you with areas of success and opportunities for improvement.
- Assign administrator, planner and auditor access based on need.
- Lock completed assessments to prevent unauthorized or accidental modifications.
- Comprehensive Management reporting.
Assess your Residual Risk and receive action-based reporting.
RESIDUAL RISK DETAIL REPORT
The purpose of the Residual Risk Detail Report is to provide management with a detailed report of mitigating controls, risk factors, threat landscape, and residual risk for all business units/departments and/or IT systems/applications.
RTO BUSINESS UNIT PROCESS
The Residual Risk Exception Report by RTO displays a listing of any business unit or IT system evaluated where residual risk is outside of the company’s risk tolerance.
ACTION ITEM REPORT BY RTO
The Action Item Report by RTO displays all action items listed by RTO, along with Mitigating Control, Due Date, Assigned To, and Status.
RISK TOLERANCE GRAPH BY RTO
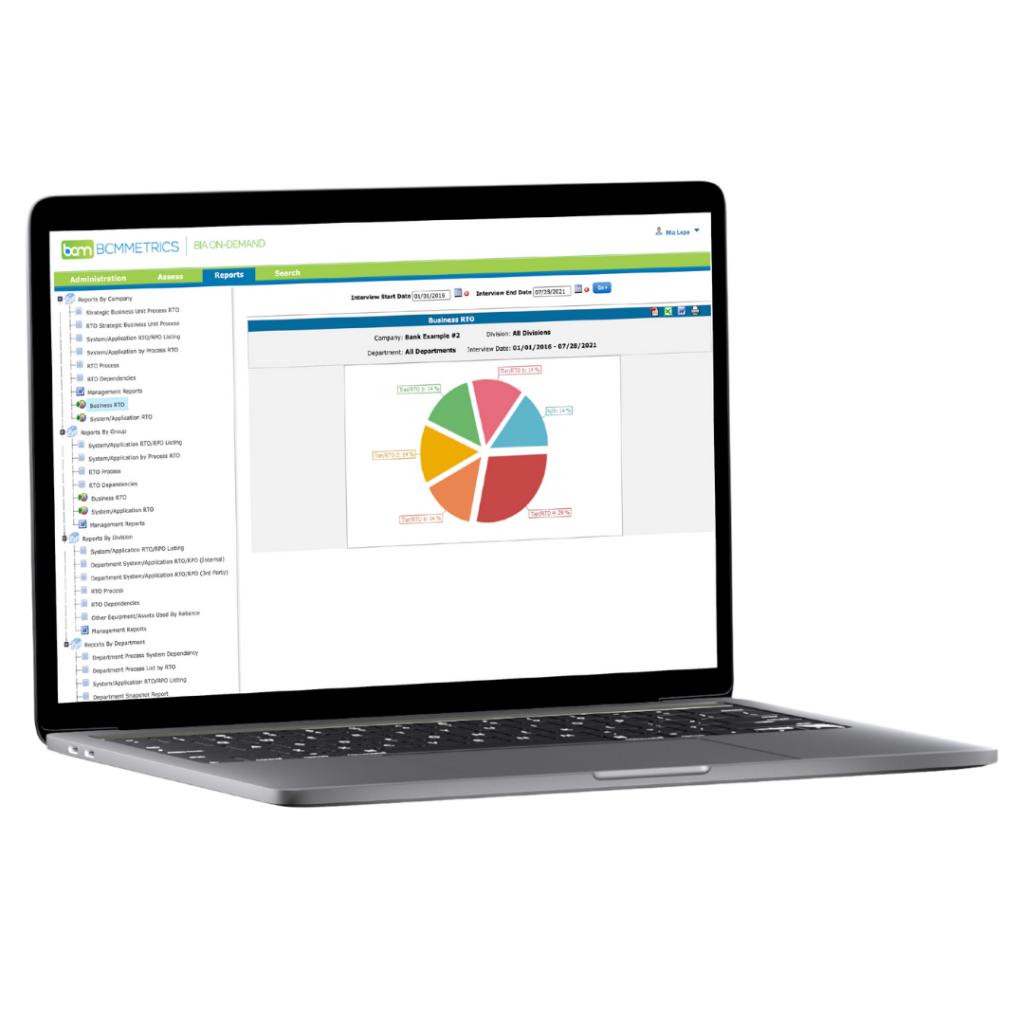
The Risk Tolerance Graph by RTO uses a pie chart to depict areas outside and within risk tolerance. The BCM practitioner can select the RTO to show in the pie chart. Clicking on the pie chart produces a bar graph depicting areas outside of tolerance along with their scores.


