Business Continuity
Crisis Management
Disaster Recovery
BCaaS
Program Augmentation
Training and Awareness
Compliance Confidence
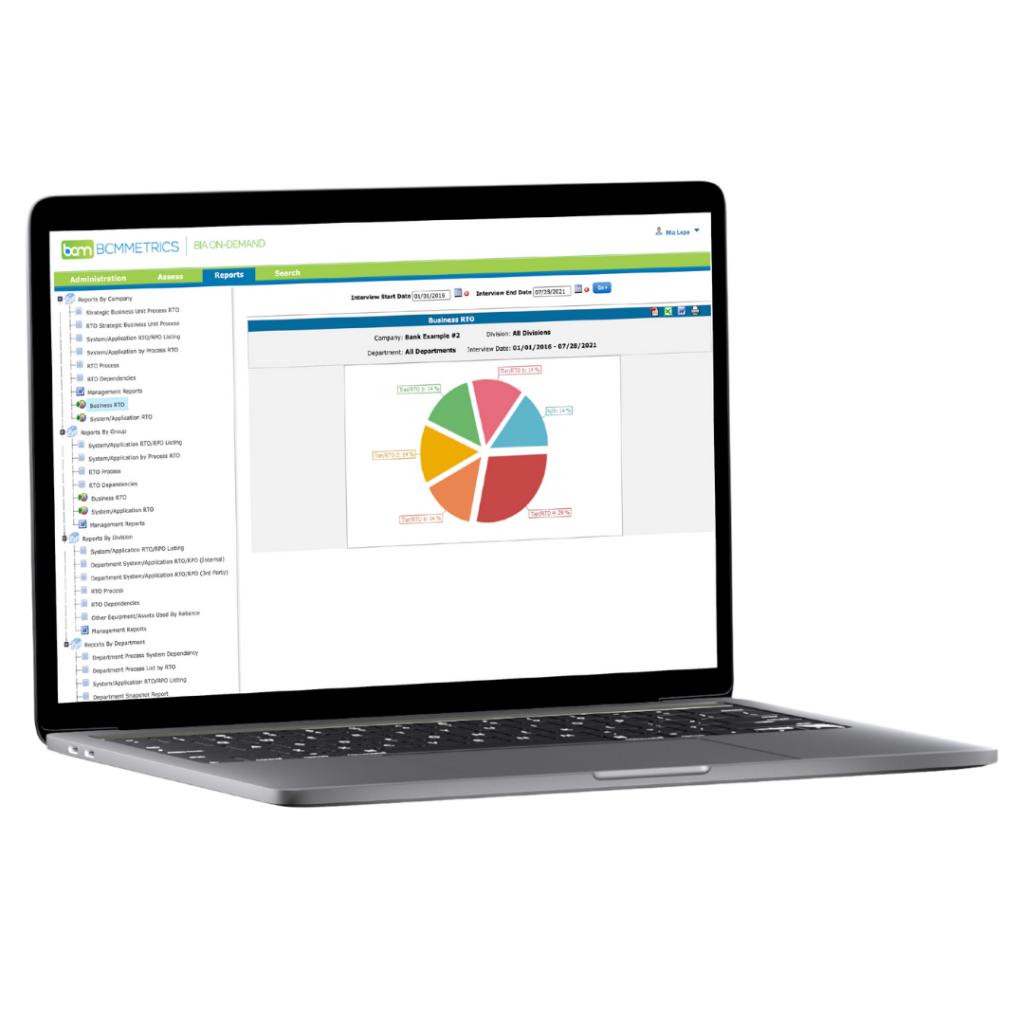
BIA On-Demand
Login
BCM Planner
BCM One